Context
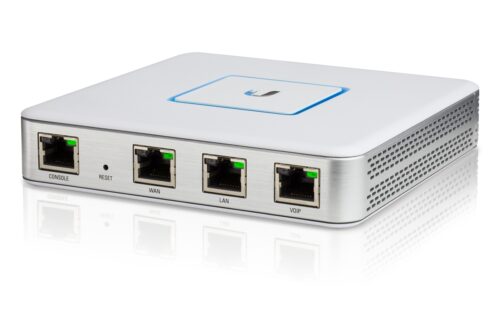
Looking on which client in my home network is consuming bandwith and trying to catch / debug some attacks and network flows, I played with Unifi gateway (Model UniFi Security Gateway 3P) to export netflow data to a pmacct/nfacctd netflow receiver.
Configuration
First you need to define netflow / flow-accounting configuration on Unifi gateway.
CLI
For testing purpose, you could enable temporary the netflow export using a manual configuration using direct configuration on CLI. Take care, on each change on your unifi controller, configuration manually set on the gateway will be erased.
user@gw:~$ configure
[edit]
user@gw# show system flow-accounting
 ingress-capture pre-dnat
 interface eth0
 interface eth1
 netflow {
     sampling-rate 10
     server 192.168.1.100 {
         port 6999
     }
     timeout {
         expiry-interval 60
         flow-generic 60
         icmp 300
         max-active-life 604800
         tcp-fin 300
         tcp-generic 3600
         tcp-rst 120
         udp 300
     }
     version 9
 }
 syslog-facility daemon
[edit]
Unifi controller
In order to deploy this configuration automatically using the Unifi controller, and to be kept after a reboot or any configuration change, you should create a config.gateway.json file to automate / keep this deployment on each provisioning, on each site ID folder :
✘ ⚡ root@controller /var/lib/unifi/sites/mysiteID cat config.gateway.json
{
"system": {
"flow-accounting": {
"ingress-capture": "pre-dnat",
"interface": [
"eth0",
"eth1"
],
"netflow": {
"sampling-rate": "10",
"server": {
"192.168.1.100": {
"port": "6999"
}
},
"timeout": {
"expiry-interval": "60",
"flow-generic": "60",
"icmp": "300",
"max-active-life": "604800",
"tcp-fin": "300",
"tcp-generic": "3600",
"tcp-rst": "120",
"udp": "300"
},
"version": "9"
},
"syslog-facility": "daemon"
}
}
}
With this configuration deployed, you should be able to receive UDP netflow export on port 6999, with a 1 for 10 sample rate. It means 1 out 10 packets will be sampled to the netflow exporter / receiver. This value should be adjusted carefully to avoid CPU exhaustion on your Unifi gateway (processor is some old stuff, with no powerful capacities)
Data Collection
I’ve always been a pmacct‘s project fan 😉 So naturally, I deployed a nfacctd daemon on my home server to collect netflow exports and aggregate them using some primitives.
user@home ~ cat /opt/pmacct/etc/nfacctd.conf ! nfacctd configuration for home ! ! nfacctd daemon parameters ! for details : http://wiki.pmacct.net/OfficialConfigKeys ! daemonize: false pidfile: /var/run/nfacctd.pid logfile: /var/log/nfacctd.log syslog: daemon core_proc_name: nfacctd ! !interface: enp0s25 nfacctd_ip: 192.168.1.100 nfacctd_port: 6999 !nfacctd_time_new: true !nfacctd_disable_checks: true !nfacctd_renormalize: true nfacctd_ext_sampling_rate: 10 geoip_ipv4_file: /usr/share/GeoIP/GeoIP.dat geoip_ipv6_file: /usr/share/GeoIP/GeoIPv6.dat !aggregate[traffic]: in_iface,out_iface,proto,tcpflags,ethtype,src_host_country,dst_host_country,src_host,dst_host aggregate[traffic]: in_iface,out_iface,proto,tcpflags,src_host_country,dst_host_country,src_host,dst_host ! storage methods plugins: print[traffic] ! print rules print_output_file[traffic]: /tmp/nfacctd/%s.json print_output: json print_history: 2m print_history_roundoff: m print_refresh_time: 60 plugin_pipe_size: 102400000 plugin_buffer_size: 102400
After installing and configure with the following nfacctd.conf file, you should be able to play with pmacct command to see netflow exports, if you dump results through a pipe, or directly look at the json print export.
Example of JSON output generated :
{
	"event_type": "purge",
	"iface_in": 2,
	"iface_out": 3,
	"ip_src": "207.180.192.205",
	"ip_dst": "192.168.1.101",
	"country_ip_src": "DE",
	"country_ip_dst": "",
	"tcp_flags": "0",
	"ip_proto": "udp",
	"stamp_inserted": "2020-08-20 11:28:00",
	"stamp_updated": "2020-08-20 11:29:01",
	"packets": 1,
	"bytes": 125
}
{
	"event_type": "purge",
	"iface_in": 3,
	"iface_out": 2,
	"ip_src": "192.168.1.101",
	"ip_dst": "5.187.71.162",
	"country_ip_src": "",
	"country_ip_dst": "RU",
	"tcp_flags": "0",
	"ip_proto": "udp",
	"stamp_inserted": "2020-08-20 11:28:00",
	"stamp_updated": "2020-08-20 11:29:01",
	"packets": 1,
	"bytes": 311
}
Data Export
After this you are able to parse data produced by nfacctd collector and push it to a TSDB.
Python – From JSON to InfluxDB
Not sure InfluxDB is the best to doing this, due to the high cardinality on tags. But anyway, for home setup, it’s sufficient.
I wrote a quick and dirty python script that parse and enhance data (like SNMP ifIndex name provided by nfacctd) and push it to InfluxDB.
I will probably publish it to github when it will be cleaned up.
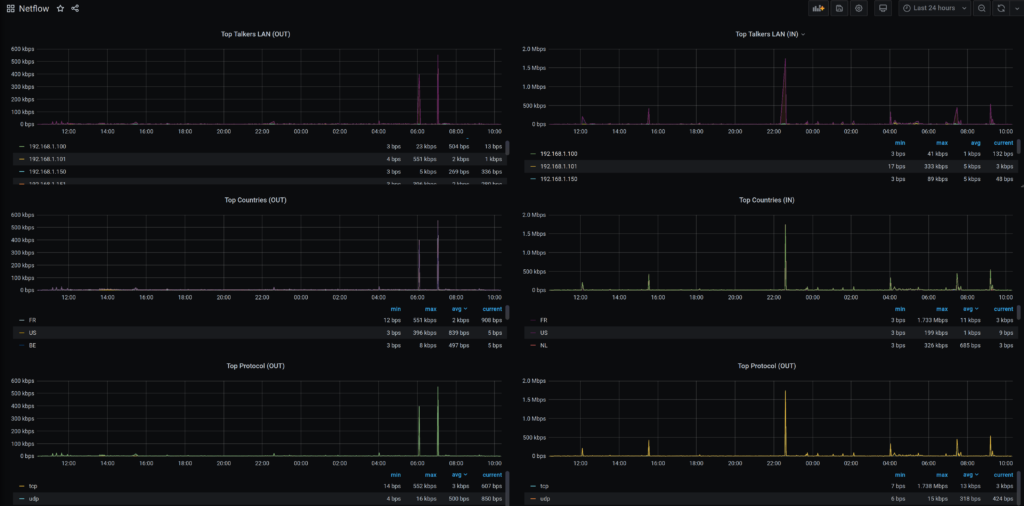
Grafana
Here is an example of what you can produce with data inside the TSDB. Top Countries, Top IP talkers…