I can’t stop digging around Routinator. See previous posts to understand everything 😀
Routinator provides an http interface to check about its inside, from metrics to status through VRPs debug.
Metrics
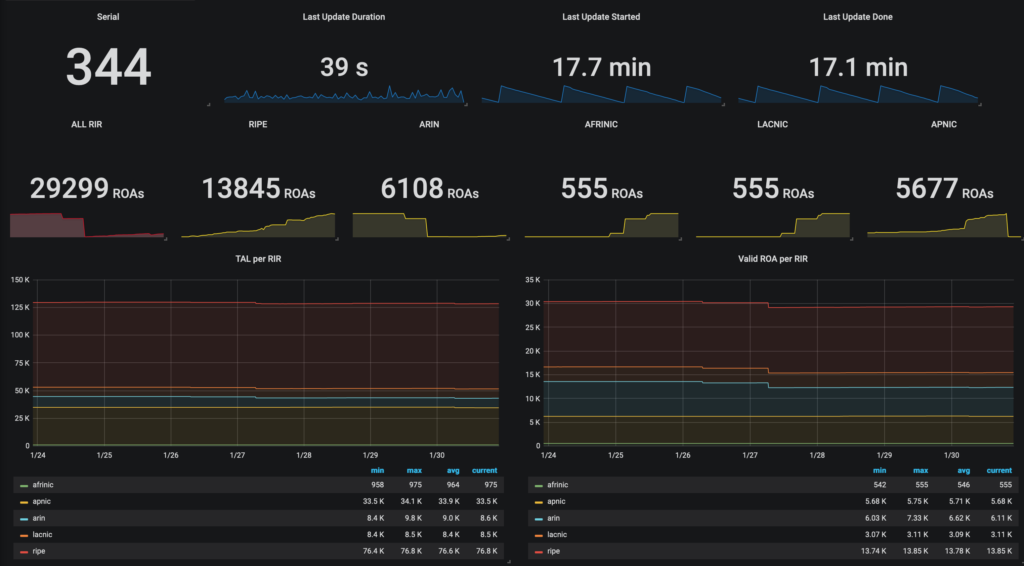
Go to your server on your URL http://srv-rpki01:8080/metrics and you will get the following output that can be pushed to Prometheus (or anything else !)
# HELP routinator_valid_roas number of valid ROAs seen
# TYPE routinator_valid_roas gauge
routinator_valid_roas{tal="ripe"} 13845
routinator_valid_roas{tal="arin"} 6108
routinator_valid_roas{tal="apnic"} 5677
routinator_valid_roas{tal="afrinic"} 555
routinator_valid_roas{tal="lacnic"} 3114

# HELP routinator_vrps_total total number of VRPs seen
# TYPE routinator_vrps_total gauge
routinator_vrps_total{tal="ripe"} 76757
routinator_vrps_total{tal="arin"} 8570
routinator_vrps_total{tal="apnic"} 33528
routinator_vrps_total{tal="afrinic"} 975
routinator_vrps_total{tal="lacnic"} 8475

# HELP routinator_last_update_start seconds since last update started
# TYPE routinator_last_update_start gauge
routinator_last_update_start 2004

# HELP routinator_last_update_duration duration in seconds of last update
# TYPE routinator_last_update_duration gauge
routinator_last_update_duration 39

# HELP routinator_last_update_done seconds since last update finished
# TYPE routinator_last_update_done gauge
routinator_last_update_done 1965

# HELP routinator_serial current RTR serial number
# TYPE routinator_serial gauge
routinator_serial 344
It will help you to create dashboard on Grafana like the following one :

Status
Go to http://srv-rpki01:8080/status and you will access Routinator status
serial: 344
last-update-start-at:  2020-01-30 20:41:45.411133392 UTC
last-update-start-ago: PT2280.370308920S
last-update-done-at:   2020-01-30 20:42:24.618050797 UTC
last-update-done-ago:  PT2241.163391515S
last-update-duration:  PT39.206927565S
valid-roas: 29299
valid-roas-per-tal: ripe=13845 arin=6108 apnic=5677 afrinic=555 lacnic=3114
vrps: 128305
vrps-per-tal: ripe=76757 arin=8570 apnic=33528 afrinic=975 lacnic=8475
rsync-durations:
   rsync://rpki.ripe.net/ta/: status=0, duration=0.042s
   rsync://rpki.apnic.net/repository/: status=0, duration=3.146s
   rsync://rpki.arin.net/repository/: status=0, duration=4.312s
   rsync://rpki-repository.nic.ad.jp/ap/: status=0, duration=8.018s
   rsync://rpki.afrinic.net/repository/: status=0, duration=11.770s
   rsync://repository.lacnic.net/rpki/: status=0, duration=6.843s
   rsync://rpki-repo.registro.br/repo/: status=0, duration=7.629s
   rsync://localhost/repo/: status=10, duration=0.004s
rrdp-durations:
   https://rrdp.ripe.net/notification.xml: status=200, duration=1.590s
   https://rrdp.apnic.net/notification.xml: status=200, duration=4.034s
   https://ca.rg.net/rrdp/notify.xml: status=200, duration=0.492s
   https://rpki.cnnic.cn/rrdp/notify.xml: status=200, duration=2.294s
   https://rpki-repo.registro.br/rrdp/notification.xml: status=200, duration=1.428s
   https://rrdp.rpki.nlnetlabs.nl/rrdp/notification.xml: status=200, duration=0.280s
   https://rrdp.arin.net/notification.xml: status=200, duration=0.910s
   https://rpki-ca.idnic.net/rrdp/notification.xml: status=200, duration=1.278s
   https://rrdp.twnic.tw/rrdp/notify.xml: status=200, duration=1.433s
   https://localhost:3000/rrdp/notification.xml: status=-1, duration=0.001s
Other methods
JSON and other output formats
Want to check about a prefix ? Check on http://srv-rpki01:8080/json, you will be able to fetch all ROAs into JSON format. Other methods exist to fetch ROAs in multiple formats, read the following: Routinator Docs – The HTTP Daemon
Check Validity
For example, go on http://srv-rpki01:8080/validity?asn=13335&prefix=1.1.1.0/24, you will be able to check validity for prefix 1.1.1.0/24 from AS13335 :
{
  "validated_route": {
    "route": {
      "origin_asn": "AS13335",
      "prefix": "1.1.1.0/24"
    },
    "validity": {
      "state": "Valid",
      "description": "At least one VRP Matches the Route Prefix",
      "VRPs": {
        "matched": [
          {
            "asn": "AS13335",
            "prefix": "1.1.1.0/24",
            "max_length": "24"
          }

        ],
        "unmatched_as": [
        ],
        "unmatched_length": [
        ]      }
    }
  }
}
Lets say, it’s the same than running a command on the server :
routinator@srv-rpki01:~$ routinator vrps -p 1.1.1.0/24
ASN,IP Prefix,Max Length,Trust Anchor
AS13335,1.1.1.0/24,24,apnic
But sometimes, it could help to be faster for the debug to query the API method directly.
If you want to check if it’s still valid for AS1 :
{
  "validated_route": {
    "route": {
      "origin_asn": "AS1",
      "prefix": "1.1.1.0/24"
    },
    "validity": {
      "state": "Invalid",
      "reason": "as",
      "description": "At least one VRP Covers the Route Prefix, but no VRP ASN matches the route origin ASN",
      "VRPs": {
        "matched": [
        ],
        "unmatched_as": [
          {
            "asn": "AS13335",
            "prefix": "1.1.1.0/24",
            "max_length": "24"
          }

        ],
        "unmatched_length": [
        ]      }
    }
  }
}
Routinator has many options to be monitored and daily used to check if there is something wrong on RPKI. It’s a real powerful tool for people who want to implement quickly and simply RPKI / Resource Origin Validation with some exceptions possible (SLURM)
Nice dashboard – care to share it? Thanks 🙂
I’ve not anymore the source file, but it’s pretty easy to reproduce with any TSDB like prometheus or grafana behind.
Checkout https://grafana.com/grafana/dashboards/11922 , You just need Prometheus
[…] RPKI – Routinator Monitoring and debug 30/01/2020 […]